
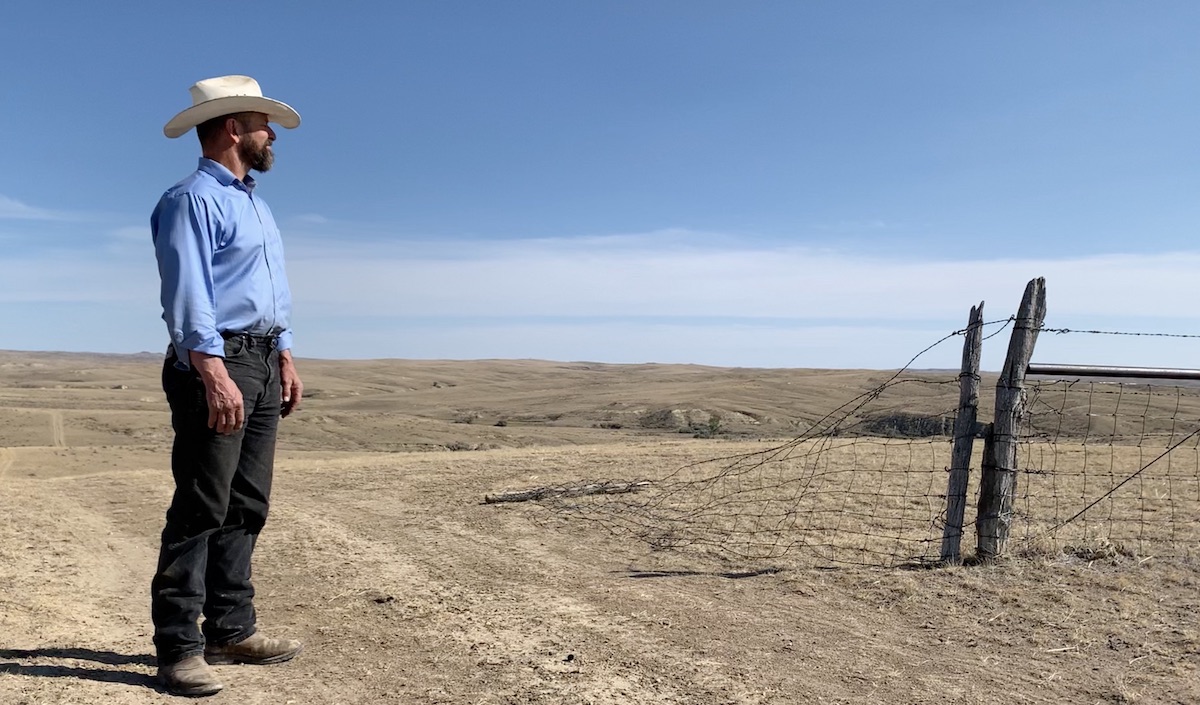
Extreme temperatures broke records in June, setting the stage for an unusually hot, dry and smoky summer. Conditions were severe enough to inspire many Wyoming residents to take stock of what appear to be changing climate patterns in the state.
Anglers report that lower streamflows and warmer stream temperatures — a threat to trout fisheries — seem to be arriving earlier in the summer. Cyanobacterial blooms appear to be more common too, and ranchers lament the continuing drought and what feels like increasingly unpredictable seasonal conditions.
This story is part of a WyoFile series examining climate change and what it means for the quality of life in Wyoming. It is supported by the MIT Environmental Solutions Initiative’s journalism fellowship program. Read about Wyoming climate observations here, and read about a Wyoming coal community in transition here.
These anecdotal observations align with more than 100 years of Wyoming-specific data, according to J.J. Shinker, professor at the University of Wyoming Department of Geology and Geophysics.
“While increases in temperature don’t appear to be reflected in significant changes in precipitation, the temperature increases are impacting water resources through early snow melt, faster runoff and greater evaporation at the surface, all of which enhance drought,” Shinker said.
To better understand how climate is changing in the state, Shinker said, it’s important to consider Wyoming’s place in the world and its wide-ranging topography — from lowlands at 3,101 feet elevation to high peaks of 13,809 feet.
Perhaps the most significant climate trend in Wyoming is that its highest elevations are warming fastest.
That’s important, Shrinker said, because less than 8% of Wyoming’s surface — 10,000 feet in elevation and higher — serves as a snow and glacial “waterbank,” and a primary driver of annual spring runoff. And spring runoff helps drive large portions of Wyoming’s biological health and economy.
Intense springtime warming and increasing variability in both temperature and precipitation are also critical trends.
“Let’s have a conversation about what we can do and how we can start preparing ourselves.”
Jodee Pring, President, Wyoming Water Association
The annual mean springtime temperature in the Upper North Platte Valley, for example, has increased by 3.6 degrees Fahrenheit since 1920, according to National Oceanic and Atmospheric Administration data. That’s double the global average increase of about 1.8 degrees Fahrenheit. That rate of warming has major implications for a watershed that millions of people depend on.
In other words, when and where temperatures are increasing most, and when and where precipitation falls and melts, shapes the pulse of life and commerce in Wyoming. And that pulse is changing in ways that indicate significant disruptions.
With the help of MIT’s Environmental Solutions Initiative and the University of Wyoming’s Department of Geology & Geophysics, WyoFile examined Wyoming climate data to learn how climate change is playing out in the state.
Wyoming trends
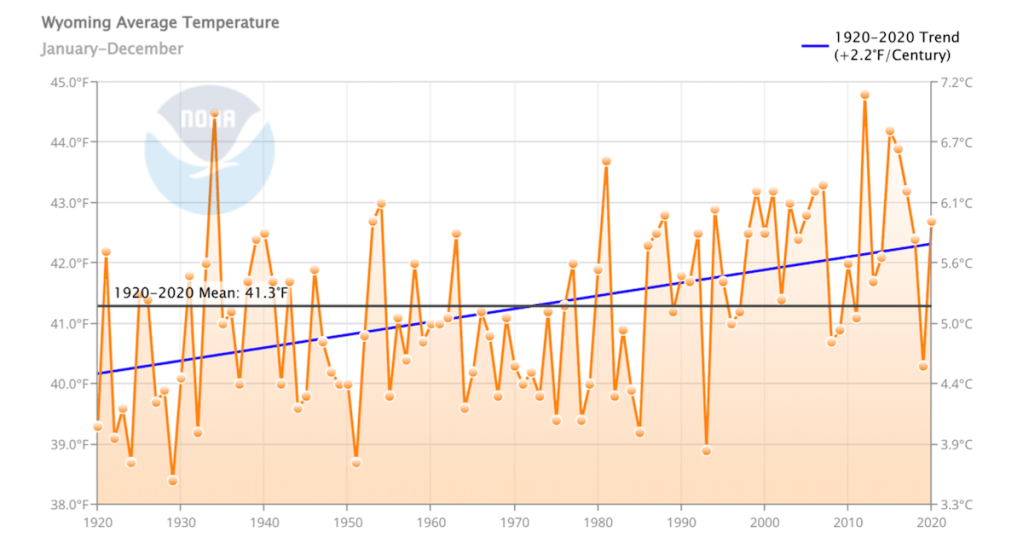
The statewide annual mean temperature increased 2.2 degrees Fahrenheit from 1920 to 2020, according to National Oceanic and Atmospheric Administration data.
What’s more consequential to Wyoming residents, though, are the geographic- and seasonal-specific trends. That’s because temperature significantly drives water availability in arid Wyoming — both generally throughout the year and more specifically during spring runoff. And water availability defines much of Wyoming’s natural and human-built systems.
Underlying the annual mean temperature change of +2.2 degrees Fahrenheit are more granular changes. Temperatures are increasing every month and every season of the year — and at different rates.
Wyoming’s winters, for example, are warming at an alarming pace.
The annual mean temperature trend for Wyoming’s winter season since 1920 is +2.8 degrees Fahrenheit — higher than the annual mean temperature rise. This increases the likelihood of rain-on-snow events at high elevations, which erodes the longevity of high-elevation snowpack.
In the context of water availability, that plays directly into Wyoming’s critical spring season.
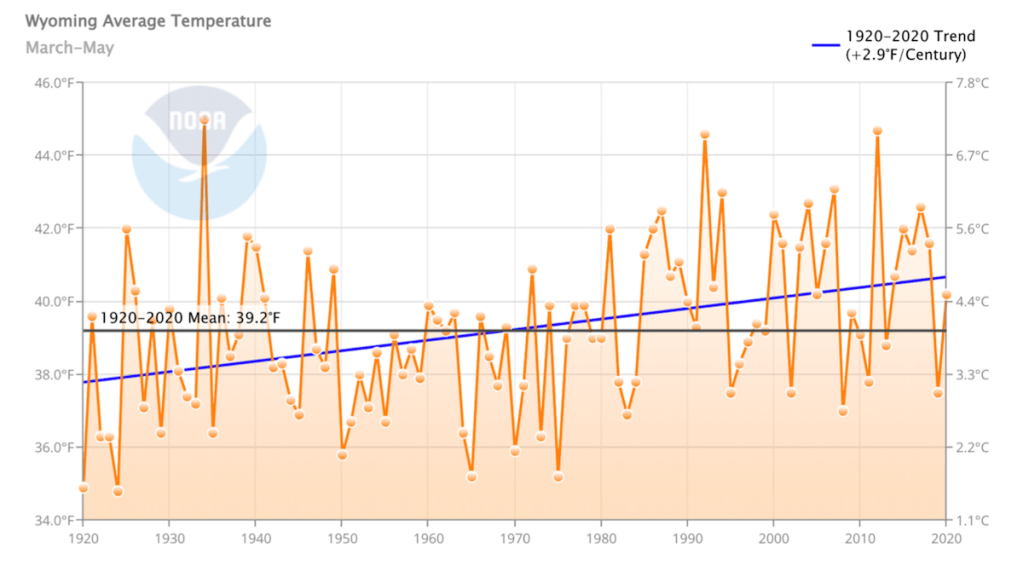
Among Wyoming’s seasons, the annual springtime mean temperature trend is steepest: +2.9 degrees Fahrenheit. This results in earlier and accelerated melt, which presents myriad changes and challenges.
Not only does it increase the likelihood of springtime flooding and surface-to-atmosphere evaporation, it also means that irrigated crop and ranching operations have a shrinking time window to benefit from spring runoff.
Reservoirs and irrigation systems have only so much capacity and work most efficiently with an ample and steady supply of melt runoff. A more intense and shorter-lived spring runoff may overwhelm irrigation and storage capacities, meaning the state can’t make beneficial use of its water.
These dynamics are already at play in south-central Wyoming. The rate of annual mean springtime temperature change for the Upper North Platte River region around Saratoga is +3.6 degrees Fahrenheit. The result is, on average, the snowmelt starting approximately 13 days earlier than it did a century ago, according to research by the University of Wyoming.
“When spring runoff comes fast and short like that, it’s there and then it’s gone,” Wyoming Water Association President Jodee Pring said. “[Irrigators] are not prepared for anything like that. So I think we need to think about changing irrigation methods. Some of that is the timing of when they might plant and when they may harvest, because I think a lot of [irrigation and ag practices] are built on tradition.”
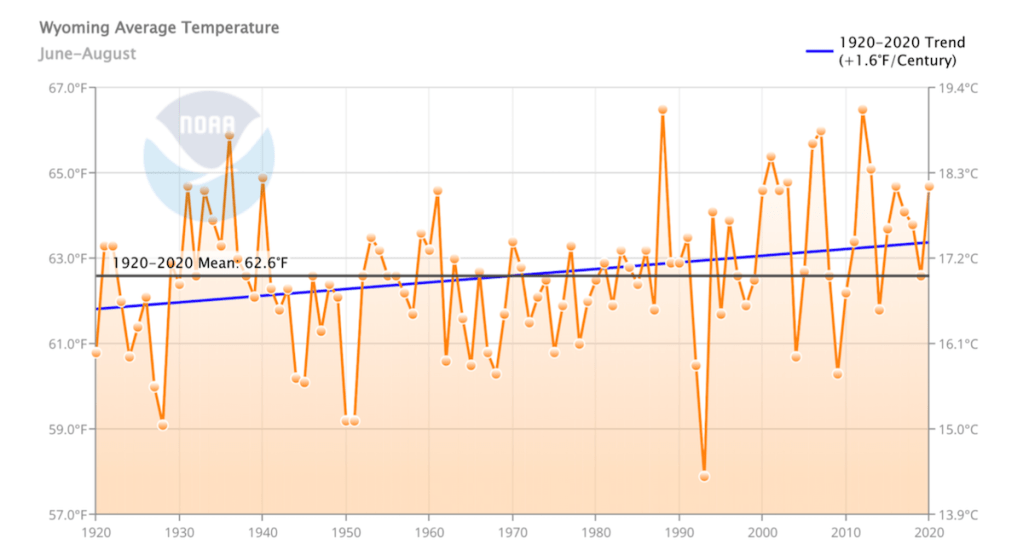
Although Wyoming’s summer and fall seasons are warming at slower rates, those changes still threaten to compound the effects of warming winter and spring seasons. The annual mean temperature increase is +1.6 degrees Fahrenheit for the summer season and +1.5 degrees Fahrenheit for the fall.
Absent ample summertime rainfall, reservoirs might not be replenished for mid- and late-summer irrigation. The combination of warmer springtime and summertime temperatures also contributes to more evaporative loss and increases the likelihood of lower and warmer streamflows earlier in the summer — a threat to aquatic life, including Wyoming’s trout fisheries.
The trend has major implications for the Upper North Platte River Valley where its impact to water resources pose a threat to an economy rooted in agriculture and tourism. It also poses a threat to municipalities, businesses and agricultural operations throughout the 350-mile-long Platte River drainage in Wyoming, as well as for downstream users in Nebraska.
Where temperature trends are most consequential
Wyoming’s latitude and relatively high- and wide-ranging elevation are major factors when it comes to where warming temperature trends and variability are most consequential.
Even slight temperature trends at high elevations can play an outsized role for natural and human systems for much of the state.

Even during an exceptionally cold year, 2019, the temperatures at Wyoming’s highest elevations stood out as anomalous against a 30-year average, showing warmer temperatures than lower elevations that year. The same applies to 2012, Wyoming’s warmest year in recent history, revealing a persistently steeper trend in warming at high elevations.
Wyoming precipitation
Variability and unpredictability have always been the hallmarks of precipitation in Wyoming and the interior Rocky Mountain Region, UW’s Shinker said. There’s very little seasonality for precipitation here, with the general exception for winter snow accumulations at high elevation.
That generally holds true when examining precipitation data trends over the past century; unpredictability and variability are still the primary hallmarks — only more so.
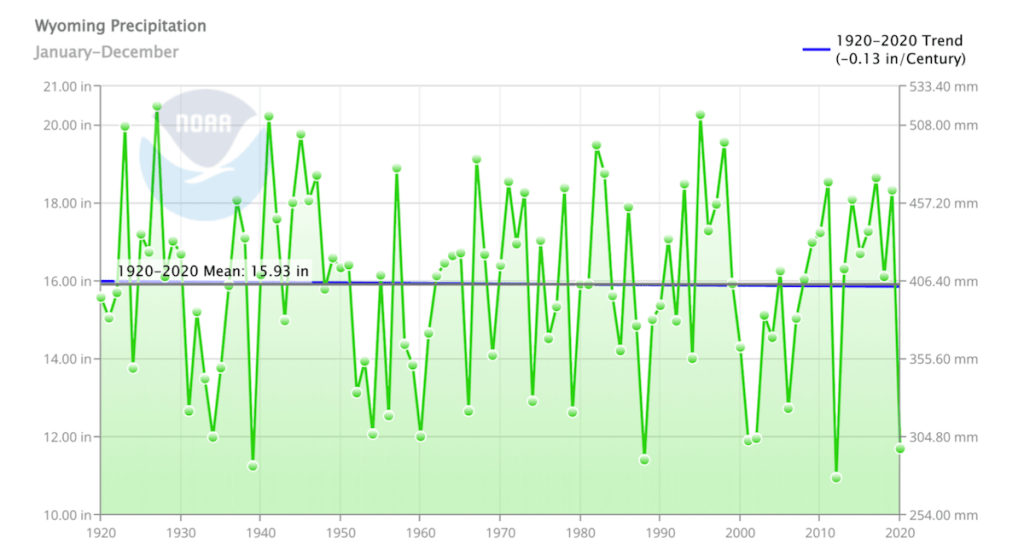
Consider the change in Wyoming’s annual mean precipitation over the past 100 years: -0.13 inches — a mere 0.008% decrease from the annual mean of 15.93 inches. That alone is not substantial. However, the 100-year dataset reveals a distinct trend of increasing variability that’s especially prominent in recent decades.
The most extreme example is 2011, one of the wettest years on record in Wyoming, only to be followed in 2012 with the driest (and warmest) year in Wyoming’s history.

Broken out by season, the annual mean precipitation trends over the past century are a mix of slight increases and decreases: winter, -0.04 inches; spring, +0.3; summer, -0.57; fall, +0.2.
The data, which appears inconsequential, makes it difficult to project future trends.
However, there’s a clear increase in springtime precipitation variability, even compared to the increasing variability throughout the rest of the year. Combined with rising springtime temperatures, it increases the likelihood of severe springtime conditions, including dangerous late blizzards and flooding.
It’s also important to understand that an increase in variability and extreme conditions can have major implications for a state where life is generally dialed into seasonal patterns and relatively dry conditions.
For example, 2019 was exceptionally wet — the 17th wettest on record in the state — but came during a long period of drought. Although it was some measure of relief, it also wreaked havoc for some ag operations.

“When an extremely wet year came along it [overwhelmed a lot of] infrastructure,” said Rhonda Brandt, Wyoming state statistician for the USDA National Agricultural Statistics Service. “The animals couldn’t go to their normal grazing places because they were flooded out. The ranchers, they couldn’t do their normal rotation through their pastures because things were coming ripe at different times. There was more disruption by that one wet year than by the last 50 years of dryness.”
Climate trends are also moving toward more intense and longer-lasting droughts in Wyoming.
The Palmer Drought Severity Index uses temperature and precipitation data to estimate relative dryness. The trend over the past century indicates that Wyoming’s climate is moving toward more persistent “moderate drought” conditions than in the past.
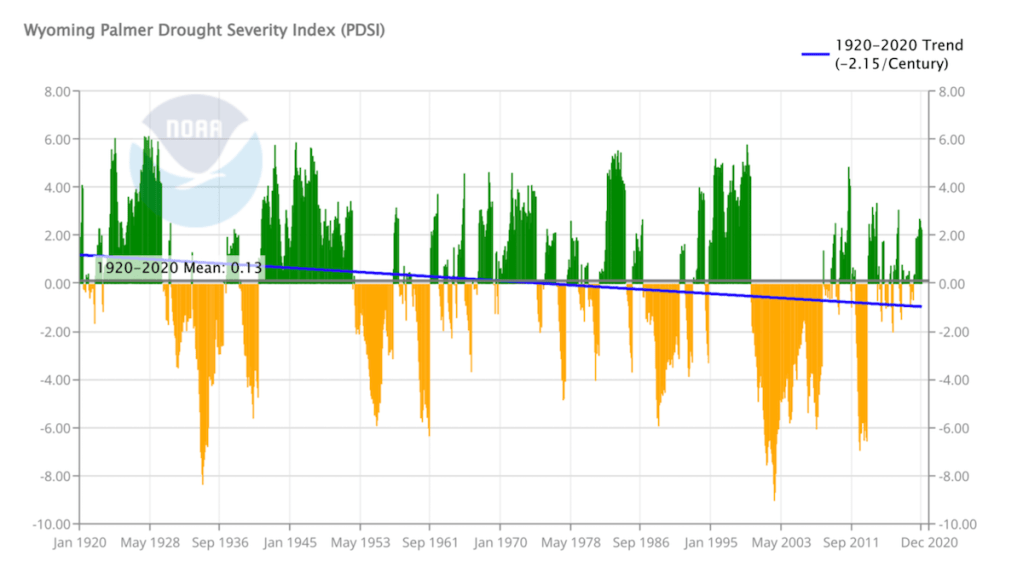
With continued warming, and if there is little to no increase in precipitation, the trend could escalate further, to more persistent “severe drought” in the future, according to the PDSI.
Beginning the conversation
Climate trends and their potential impacts could touch many aspects of life in Wyoming.
Wildfires have already become more intense and more frequent. Warming trends also increase threats of invasive insect, plant and aquatic species. Changes already being measured, and felt, indicate transformation for all manner of habitat that supports wildlife, human health and economic activity.
With those implications in mind, the time has come to start a statewide conversation, many say.
“Let’s have a conversation about what we can do and how we can start preparing ourselves,” Pring of the Wyoming Water Association said. “What are we missing? What do we need to do, and what do state agencies need to do to educate people? Are we not publishing the right data? Is it too hard to understand?”
Existing data and ongoing analysis must be compiled and made readily accessible in ways that Wyoming stakeholders can understand it, UW’s Shinker said.
“A climate assessment, led by a state climatologist, would be an important step in planning for Wyoming’s climate future,” Shinker said. “Assessing changing climate on Wyoming’s environment and economy is imperative for people in the state to prepare for future impacts.”
So far, there’s no effort to conduct a comprehensive Wyoming-specific climate assessment, and Wyoming has been without a State Climatologist for a decade.
A state climatologist “is charged with making sure we’ve got that reliable data and then being able to serve that up to people to help them come to the table and have those collaborative conversations,” Pring said. “If people don’t even have a base of where everybody starts and has the same information, the conversation isn’t going to go very far.”
While there are no plans to fill the vacant State Climatologist position, a group of University of Wyoming faculty has applied to the National Science Foundation for financial support to build upon the Greater Yellowstone Climate Assessment.
“Our aim is to develop the resources at UW to help communities across the state adapt and address the various challenges tied to the climate and related economic transition that is underway,” said Bryan Shuman, director of the University of Wyoming-National Park Service Research Center in Grand Teton National Park, a lead author of the Greater Yellowstone Climate Assessment.
Resources
Greater Yellowstone Climate Assessment
Water Resources Data System & State Climate Office
Fourth National Climate Assessment
Intergovernmental Panel on Climate Change
National Oceanic and Atmospheric Administration’s National Centers for Environmental Information
Climatic Shifts in the Availability of Contested Waters: A Long-Term Perspective from the Headwaters of the North Platte River. Jacqueline J. Shinker, Bryan N. Shuman, Thomas A. Minckley & Anna K. Henderson. September 15, 2010.
The North Platte River Basin: A Natural History, by Emilene Ostlind, WyoHistory.org, November 8, 2014
Special Report on the Ocean and Cryosphere in a Changing Climate, Chapter 2, High Mountain Areas, Intergovernmental Panel on Climate Change, September 2019.
PRISM Climate Group, Oregon State University, Precipitation and temperature data for anomaly maps.
This story has been corrected to note the average global temperature increase since 1920 is about 1.8 degrees Fahrenheit. — Ed
Since about 90 percent of Wyoming irrigation is just for alfalfa anyway there will really be no loss of anything critical to people even with those unfortunate draughts.
Thanks Dustin. Great article. Appears very well researched. I was happy to see the condensed version make the front page of the Wyoming Tribune-Eagle.
We’ve been without a state climatologist for a decade with no interest in filling the bill. Wyoming has always been short-sided and ill-fit to nurture its resources.
My grandfather was a hard core conservative conservationist Republican. I see him turning in his grave.
Excellent overview, Dustin. Quite different from the happy talk from Bill Sniffing at Cowboy State Daily.
Thanks for this information-filled article. I have just one correction to offer. Global warming since 1920 has been 1 degree Celsius not 1 degree Fahrenheit. 1 °C is equal to 1.8 °F, so the warming observed in the Upper North Platte Valley is twice that oberved for the entire globe. This is still a very significant difference.
The data on increased warming at higher altitudes is truly disturbing. Having been raised in Wyoming, I know how much difference less snowpack and/or early spring melting can make to Wyoming’s fishing , agriculture and wildlife.
Thank you again for identifying and publishing this important information.
Are there data from 1820? 1720? Just curious, as I am not sure that 100-year data is enough to make any conclusions. After all, Mother Earth is about 4 billion years old.
Tom Kocal, are you questioning “The Science” (TM)? *clutches pearls*
Tree ring and lake bed sediment analysis can approximate what happened in the past. For example, southwest tree rings show a 500-year mega drought well before the Industrial Age.